This article is more than 1 year old
UK spectrum map uncovers mysterious emissions in Cumbria
Not much going on in Scotland though
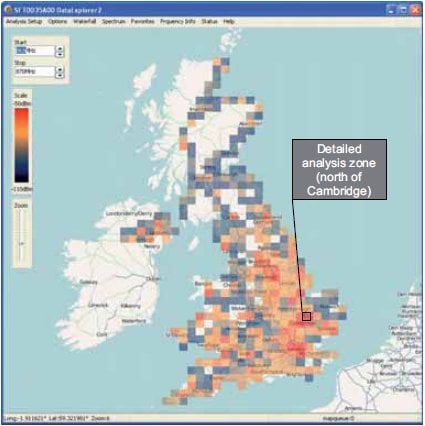
A five-month project to map spectrum usage has yielded 200GBytes of data, which shows that hardly anyone in the Highlands is using wireless, but the rest of the country is swathed in electromagnetic radiation.
The project report (pdf) includes snippets of information to demonstrate the validity of the project. The raw data from 4.2 million measurements made isn't being shared, but the report shows how users in Cambridge are overwhelming remote controls and those in Hexthorpe eschew Wi-Fi, not to mention explaining the mysterious vertical transmissions coming out of Millom.
Ofcom commissioned CRFS to map radio spectrum usage around the UK, and tipped them £300,000 to pay for it. The company enlisted sales agents to attach roof racks capable of scanning spectrum usage between 10MHz and 5GHz to their cars, which logged the data during the execution of their usual business.
In addition to unsurprising maps of 3G coverage and DAB - both commercial and BBC multiplexes - the report also shows how far digital TV still has to reach before analogue can finally be switched off.
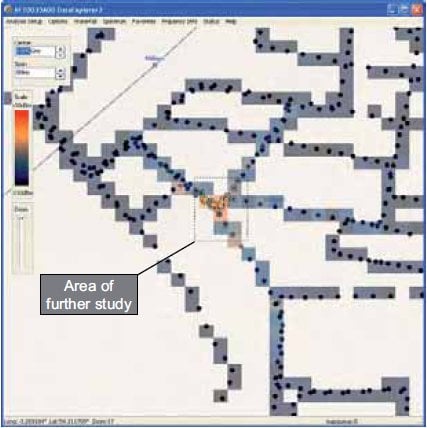
Most interesting are the anomalies highlighted, such as high-powered transmissions being found around 863-870MHz. That spectrum is supposed to be for short-range devices: wireless light switches, remote key fobs, and the like. But it seems some people are using it for rather more powerful applications as the scan of the spectrum just north of Cambridge demonstrates:

Red indicates someone using high power, too high for the frequency
The most significant anomaly uncovered, in the limited trial, was a mysterious signal at 1.075GHz in the middle of the Cumbrian village of Millom, which the company was able to track down to a shopping street and suggests is down to an unnamed shop-keeper using an imported CCTV system. The report charitably suggests the shop keeper is unaware of the illegality and took no steps to advise him/her, though a knock on the door from Ofcom is probably imminent.

No where to hide, but worth spending money to find?
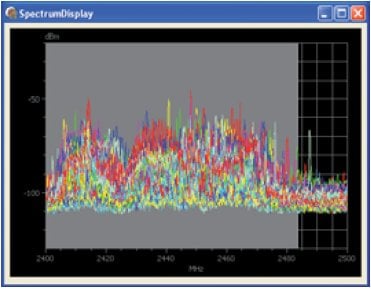
The 2.4GHz spectrum used by Wi-Fi is obviously of particular interest to the IT crowd, and the report indicates that in London this spectrum is indeed pretty crowded, but elsewhere there's room to breathe.

London is pretty packed, particularly around 2.4GHz
What's more surprising is that the spectrum mapping doesn't indicate the Wi-Fi is the dominant technology in that region:
"These plots show that there is usage in this ISM band [2.4GHz], and interestingly the signatures of the measured spectra show that the highest powers do not relate to wireless LAN activity, but rather that other technologies are being used in this band."
That's particularly interesting with reference to another, unrelated, report that Ofcom also published yesterday - into maximising effective use of the ISM bands - but we'll report on that when we've had a chance to digest it properly.
CRFS, who compiled this data, not to mention completing the analysis and authoring the report, reckon that a nationwide monitoring system could be established using their technology for around £2.11m annually, plus about the same in start-up costs. They did approach various spectrum users, including the TV broadcasters and mobile-phone network operators, all of whom said the data was very interesting but not quite interesting enough to make them want to pay for it.
Which leaves it down to Ofcom to decide if mapping the airwaves is a worthwhile use of public money. Given that Ofcom's job is to ensure efficient use of those airwaves, a map would seem an obvious place to start, but the regulator would no-doubt much prefer to see some sort of private-enterprise-driven solution that would provide the data only to those prepared to pay for it. ®
