This article is more than 1 year old
Lies, damn pies and obesity statistics: We're NOT a nation of fatties
Proof? Let's start with official UK.gov food and health data...
Again, let’s take a look at what the numbers are telling us…
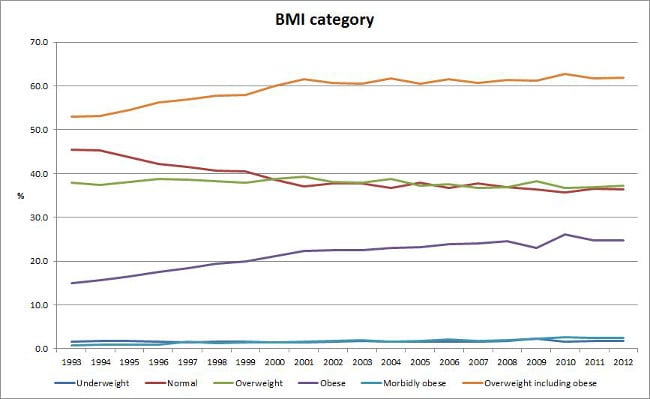
This time we’re looking at the figures from the Health Survey for England, a government sponsored annual survey of health-related data. Do we have an obesity crisis? Looking at the proportion of adults in the different categories we can see a decline in the “normal” category which seems to be levelling off.

Body Mass Index category, UK, 1993 - 2012
We can also see that the “over-weight” and “obese” groups have risen at the same time. And down there along the bottom we can see that the “morbidly obese” and “underweight” groups have shown slight increases too. Looks bad.
That’s all based on BMI. What does it look like in terms of the things we can actually measure: weight, height and waist circumference. These too show a rising trend, so clearly there is something going on and it’s not just a figment of an activist “obesity alarmist” lobby.
However, the fact that the population is getting taller is worth pointing out; this has traditionally been taken as a proxy for the effects of improved nutrition in a population. And, of course, a taller population would also be heavier: but note that a “normal” BMI puts a constraint on the rate at which height and weight can change.
Now, if we’re getting bigger and our food intake isn’t, then what gives? There are those who point out that the food intake figures are suspect. People lie about what they eat, and they usually under-estimate rather than over-estimate. But what’s important here is the trend. Even if they are lying through their teeth, we’ve no evidence that the rate of lying is changing significantly year-on-year.
One obvious solution to the conundrum is to assume our energy balance is out of kilter; that we’re eating less but the rate of what we’re burning off is going down even faster.
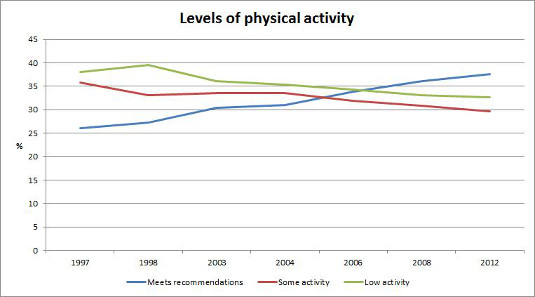
Assume that food is the input and energy expended is the output, then the input is exceeding the output even as that input is going down. This sounds plausible enough, but again, if we look at the numbers from the HSE, we can see how the population is doing in terms of meeting the government’s recommendations on physical exercise. What we see is a slow rise in the percentage of adults meeting the requirements.

Not a nation of fatties after all: Levels of physical activity meeting government guidelines are rising
However, there’s a lot more to energy expenditure than time spent doing exercise or going to the gym. As a nation we are walking less than we used to; a greater proportion of the population is involved in sedentary occupations; even housework takes up less time and effort than it used to. Let’s face it, they’re called “labour-saving devices” for a reason. We can assume that the labour saved isn’t being expended on other calorie-burning activities, on the whole.
