This article is more than 1 year old
Microsoft to Linux users: Explain yourself
Redmond wants to know Linux better so it can build monitoring tools for penguinistas
Microsoft wants to get better at monitoring Linux.
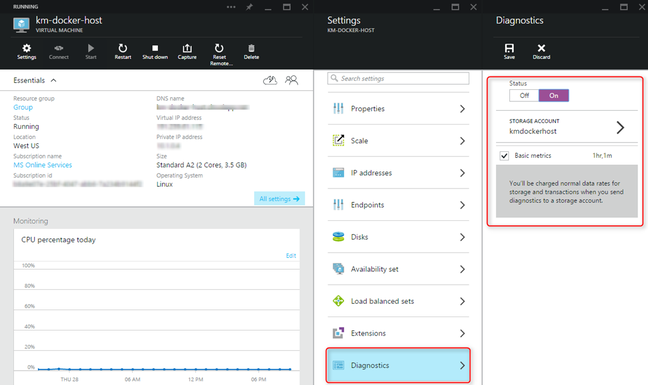
Don't pinch yourself – this isn't some weird dream. Redmond on Tuesday took the covers off a new Linux VM monitoring tool.
“A significant number of Virtual Machines on Azure today are running Linux workloads,” writes Khailid Mouss, a senior program manager for the Azure Compute Runtime. To help those folks Redmond has therefore created “new monitoring capabilities we have just released (currently in Preview) for Linux virtual machines running on Azure.”
Microsoft's also shouted out to Linux users, saying “we want to know more in-depth how your organization monitors Linux servers and challenges you face monitoring these Linux servers.”
“We are NOT trying to sell you anything, we just want you understand your pains in this area,” writes Microsoftie Satya Vel (who does his own emphases).
“If you are or could introduce us to your Linux monitoring administrators (folks responsible for tools like Nagios, Zabbix, Zenoss etc…) we would really appreciate it as this an area we want to understand.”
Back to that new monitoring tool in Azure, depicted below. Microsoft says it can measure 43 metrics* and spit 'em all out into a pretty, GUI-fied Azure console.

The preview Azure Linux Monitoring console. Click here if you wish to embiggen
To get things going, you'll need another recently-revealed Redmond release, the monitoring agent for Linux. Once you've got that installed, you're off to the races.
It's hard to imagine former CEO Steve Ballmer's Microsoft offering this kind of helping hand to Linux admins. Even if Ballmer did all-but back away from his “Linux is a cancer” comments, his Windows-centric view of the world meant Redmond was generally loth to offer assistance to users of other operating systems. That Microsoft's now courting their expertise is a remarkable change in attitude. ®
*Here's the 43 metrics, for your listicle-reading pleasure.
- CPU DPC time
- CPU IO wait time
- CPU idle time
- CPU interrupt time
- CPU nice time
- CPU percentage
- CPU percentage guest OS
- CPU privileged time
- CPU user time
- Disk queue length
- Disk read
- Disk read guest OS
- Disk read time
- Disk reads
- Disk total bytes
- Disk transfer time
- Disk transfers
- Disk write
- Disk write guest OS
- Disk write time
- Disk writes
- Mem. percent available
- Mem. used by cache
- Memory available
- Memory percentage
- Memory used
- Network In
- Network Out
- Network collisions
- Network in guest OS
- Network out guest OS
- Network total bytes
- Packets received
- Packets received errors
- Packets sent
- Packets sent errors
- Page reads
- Page writes
- Pages
- Swap available
- Swap percent available
- Swap percent used
- Swap used
