This article is more than 1 year old
Tintri T850: Storage array demonstrates stiff upper lip under pressure
Watch out, performance hogs. This is NOT a contention-based model
The UI
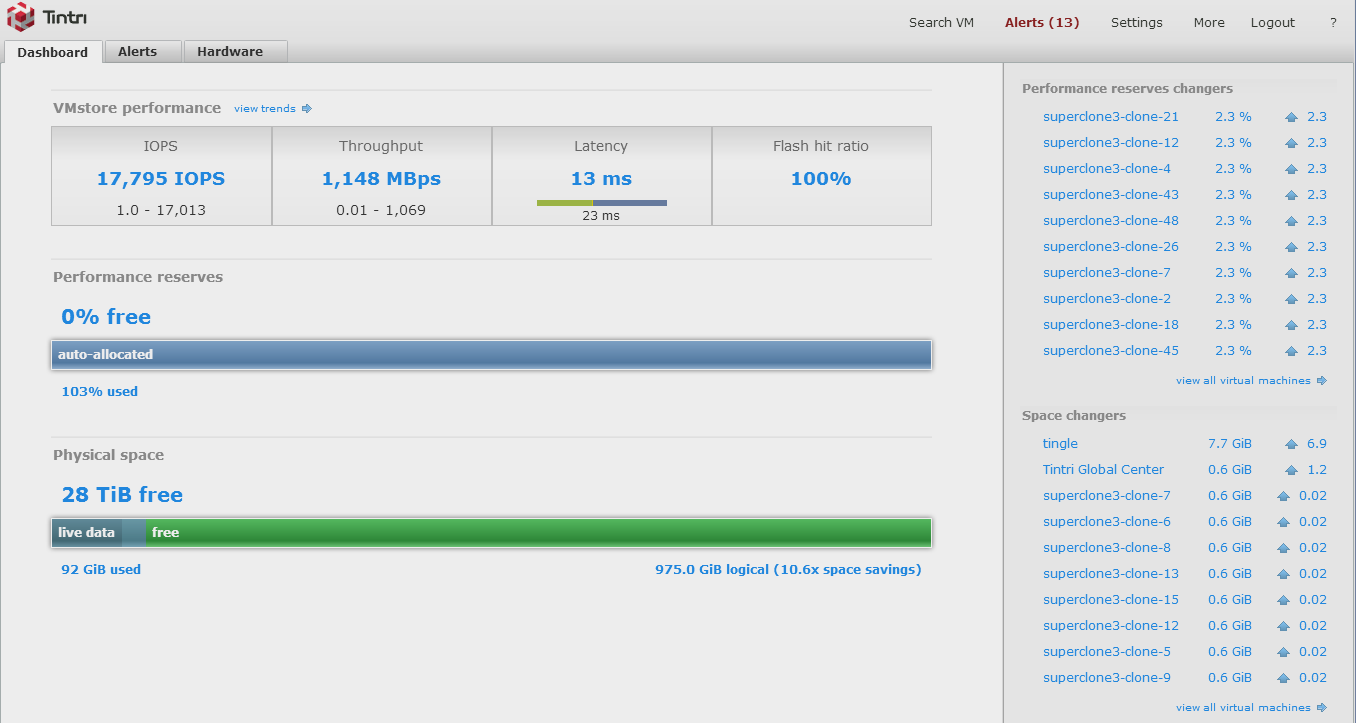
When I first reviewed Tintri two years ago I talked a lot about the novelty of its user-friendly interface. In the intervening two years this UI has had features added but the overall layout and concept has not changed all that much.
I don't view this as a bad thing. Tintri has hit upon a decent UI that largely puts the information you need in front of you. What's more, going deeper to find more information is generally pretty easy.
The UI makes it clear which VMs are using what percentage of total storage, or of the flash performance tier. VMs that change size or requirements are clearly displayed, along with the percentage change for either segment.
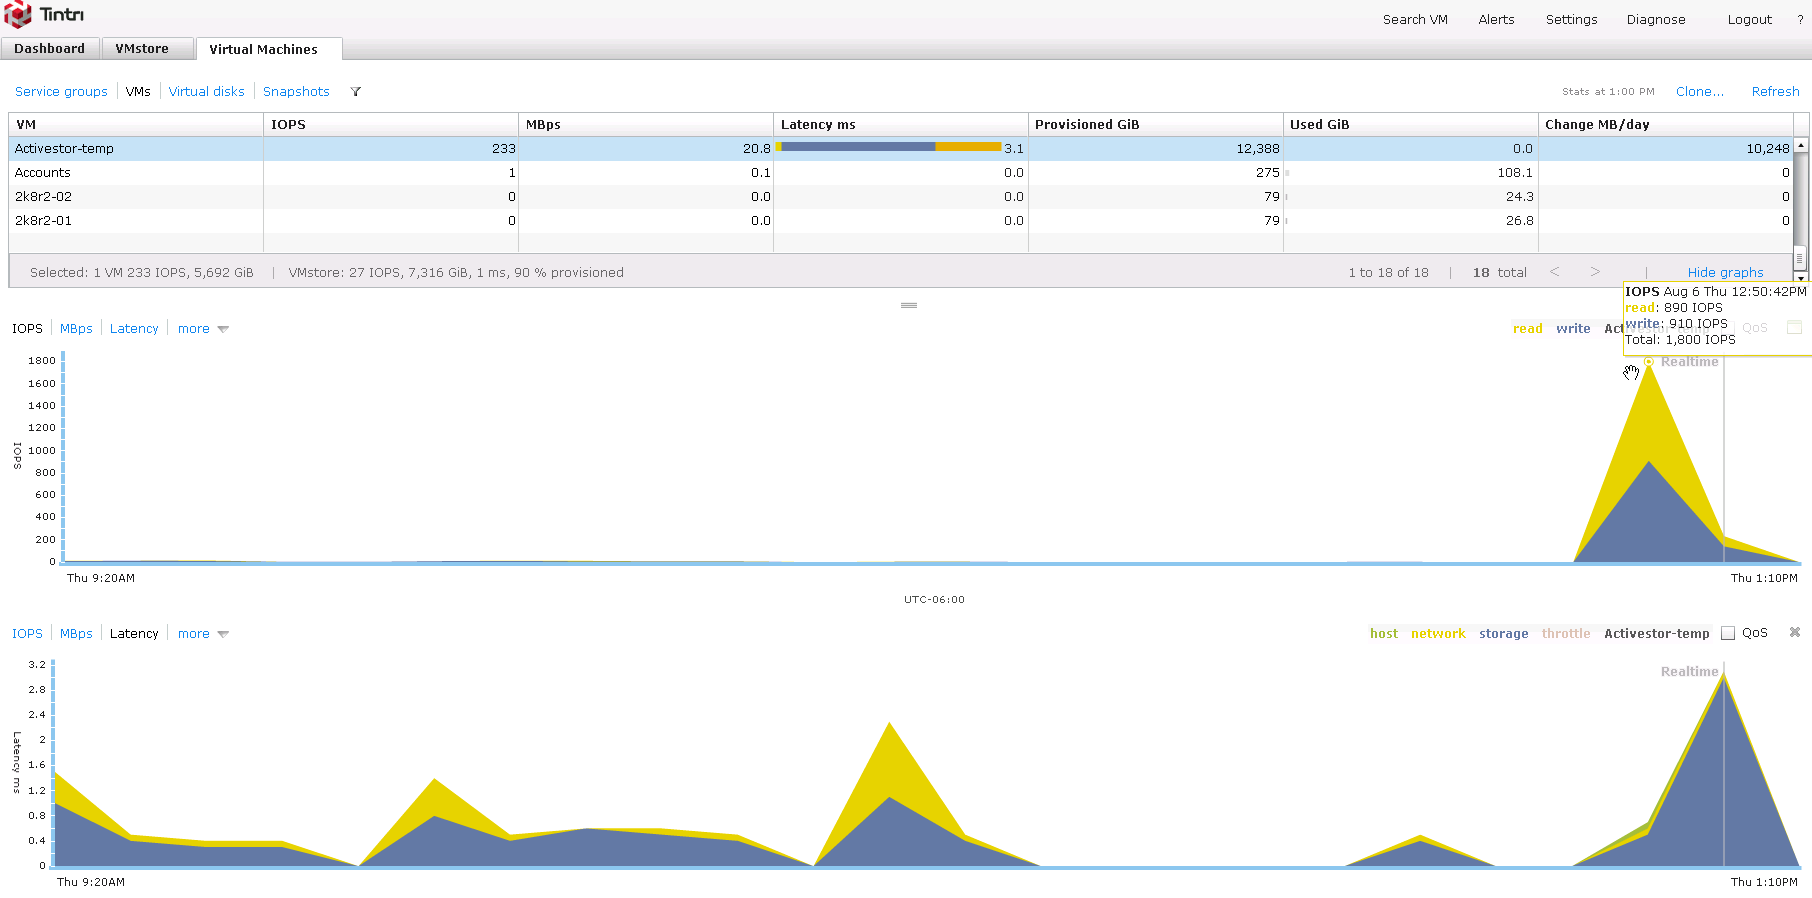
Spikes in latency, dips in flash hit ratio, or any other anomalies can be drilled into to see where the fault lies. Was the network being slow? Was the latency due to a flash miss, or did the flash miss occur and latency was mostly unaffected?
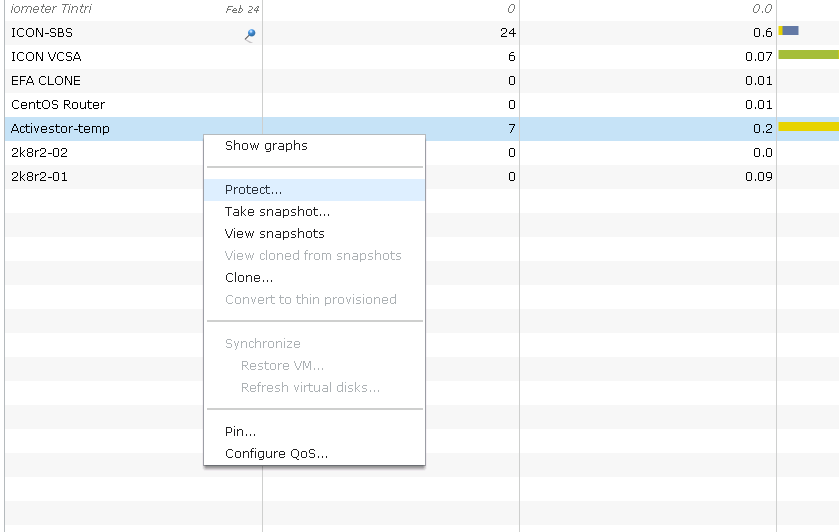
Individuals VMs can be investigated, and every graph in the system allows you to investigate performance history up to seven days old. In addition, creating clones, snapshots, replication sets and tinkering with QoS settings is all fairly simple and straightforward.
You can "protect" VMs by setting up snapshot schedules and doing fun things with replication. If you want to run more than a handful of Tintri units, however, it is strongly recommended that you invest in Tintri Global Center to manage them. Tintri Global Center is a product in its own right and I'll cover that in a future review.
Of course, no UI rests upon a bed of roses. I have my complaints. The first, as mentioned above, is that Tintri doesn't seem to understand how to differentiate between megabits, megabytes and mebibytes. I'd really like it if this were clearer.
Perhaps the most irritating item to someone trying to review the product is that there is no "refresh" button to mash for most charts, or for the main dashboard. Updates take frustratingly long and the main dashboard's numbers are a "10 second average" instead of real time numbers.
This doesn't help at all when trying to determine if I broke Tintri's IOPS record, or when I'm trying to hunt down transient speed issues in production. A true real time display would be greatly appreciated.
Next up is the "settings" page. It's clear that the Tintri UI has grown in capability over the years because a number of important settings have gotten shoved in a sub-menu of a sub menu and are kind of miserable to get at. This leads me to my final gripe: speed.
The Tintri is a very fast storage unit. The UI on my crappy ARM-based home router, however, is significantly faster. Rumour has it that the upcoming 4.0 release will see some of the speed issues addressed; however, for now what I'm working with is laggy and unresponsive.
The speed issue compounds the frustration caused by all other UI gripes, but I am aware that reviewing the unit is not exactly the designed for use case. In the real world, no administrator is going to spend a lot of time in the Tintri UI. Tintri integrates nicely into VMware's vSphere clients, and operations such as "rapid cloning" and "fast snapshotting" are easily triggered from there.
Still, the UI is most likely to see use when an administrator is troubleshooting something, and a laggy UI will only compound frustration. I sincerely hope this (admittedly minor) issue is addressed in future software releases.


