This article is more than 1 year old
Has your machine really learned something? Snap quiz time
How to tell if your algo is getting it right
Machine learning (ML) is all about getting machines to learn but how do we know how well they are doing? Answer – confusion matrices and ROC space.
Suppose we have existing data about people who buy books from our website – age, amount spent, preferred author and so on. These columns of data are known, in ML terms, as the "Predictors". For some of the customers we also know their gender, for others we don’t, but we want to know it for all customers. (In ML terms the data we are trying to predict is the "Response").
We start with the customers where we do know the gender and we feed both the Predictor and Response data into a machine learning algorithm and get it to build a model that can (hopefully) forecast the Response from the Predictors. Once we have that model, we can feed in the Predictor data for customers where we don’t know the gender and the model will tell us their gender.
Of course, before we use the new model in anger, we have to work out how accurate it is and we can do that by being slightly devious. Suppose we have gender data for 1,000 customers. We use 700 of those to build our gender-predicting model. Once we have the model we can test it by putting the Predictor data from the other 300 customers through the model. Of course, we do know the gender of these 300 but we don’t show that data to the model. Instead we get it to predict the gender and then compare this prediction to their actual gender and that tells us the accuracy of the model.
The model can be right about any one individual in two ways:
- It can accurately predict a female – we call this a True Positive
- It can accurately predict a male – True Negative
It can also be wrong in two ways:
- Predict female and be wrong – False Positive
- Predict male and be wrong – False Negative
- Third item
Note that it doesn’t matter which gender you choose to call positive and which negative.
We can summarise the performance of the model as a table which is confusingly called a confusion matrix. Suppose we tested with 300 customers and 180 were actually female.
| Prediction - female | Prediction - male | |
|---|---|---|
| Actual female 180 | True positive 175 | False negative 5 |
| Actual male 120 | False positive 10 | True negative 110 |
A bit misleading? Yes, that is accurate
We can summarise the data even further by, for example, calculating a metric which is called “Accuracy”. This is simply the sum of the two True predictions (175+110 = 285) divided by the total (285/300= 0.95). This gives us the proportion of the customers whose gender is correctly predicted and it intuitively sounds terribly sensible.
However, “Accuracy” can be a somewhat inaccurate metric. Imagine that, for example, almost all of our customers are female. We train the model with, say, 698 females and two males. If we do this in practice, we may well end up with a model that simply classifies every customer as female. And when we test it with, say, 299 females and one male, the model will classify every customer as female. The Accuracy metric will return a value of (299/300 = 0.997) which is an almost perfect score for a model that is doing a perfectly abysmal job.
So we need another metric. But that is OK because there are lots from which to choose and two of them happen to go together like smoked salmon and champagne.
TPR - not just The Pensions Regulator
The first is the True Positive Rate (TPR) which is the proportion of the actual positives (actual females) who are correctly identified (175/180 = 0.972).
The second is the False Positive Rate (FPR) which is the proportion of the actual negatives (males) who are incorrectly identified (10/120 = 0.083). Note that the first sounds sensible (what proportion of the female do we correctly classify?) and the second sounds wrong (how many of the males do we incorrectly classify?) but it turns out to be very sensible when we plot one against the other in what is gloriously called ROC space.
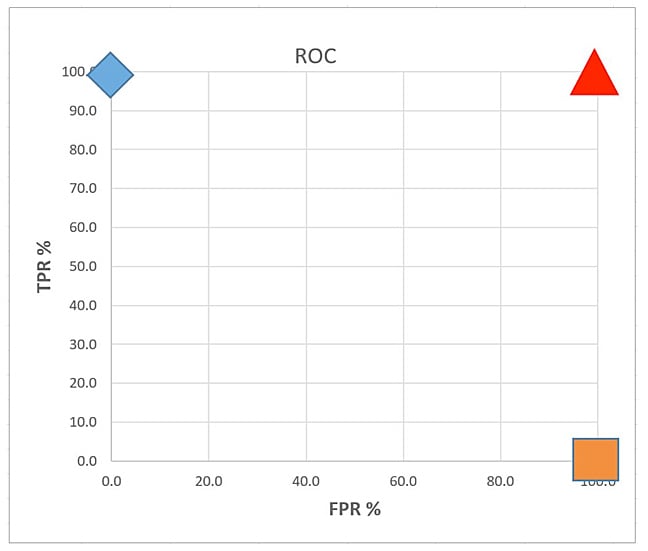
ROC space simply plots the FPR on the X axis and TPR on the Y. I’ve plotted three points below - note I turned the values into percentages.
Which of these three points are good and which are bad? Well, top left we have a blue diamond. This has a TPR value of 100 and a FPR of 0. If our model produces a point here it means that it has found every female perfectly and made zero errors finding males. So it has done a perfect job. Take-home message: top left is the place to be.
Now look at top right (red triangle with rounded corners). If our algorithm is here, it identified all the females perfectly but completely messed up with the males, identifying them all as female. Top right is NOT where you want to be. What about bottom right (orange square)? This got none of the females right and all of the males wrong. So it is clearly rubbish, right? Well, before we condemn it out of hand, think about it for a minute.
When this algorithm says “female” it is 100 per cent wrong. And when it says “male” it is 100 per cent wrong. That’s amazingly, consistently, wrong; it is epically wrong. But wait. Just suppose that when it said “female” we heard “male”. And when it said “male” we heard “female”. Why then it would be 100 per cent correct. And the point would flip to top-left.
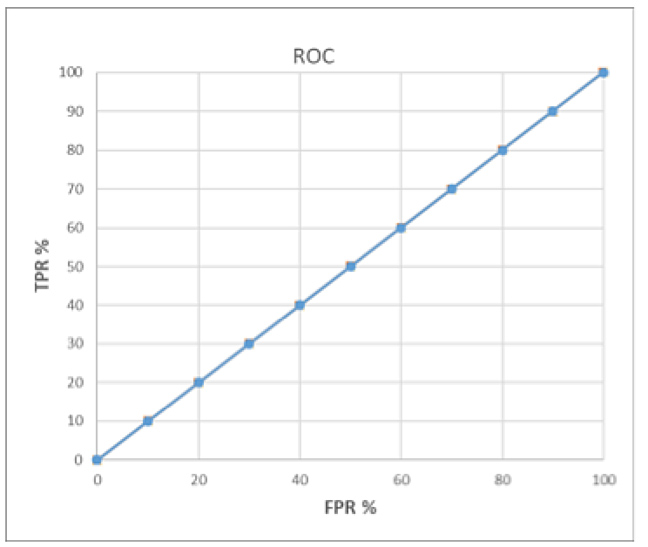
So the beauty of ROC space is that being in the top-left half is the place to be and if you ever end up in the bottom right half you can flip to the other half by reversing the predictions. The place NOT to be is on the line shown below.
The reason not be on this line is because the algorithm is doing no better than simply making random predictions for both male and female.
But the good news is that we now have an excellent way of telling how well our algorithm is doing. The further away it is from the line and the closer to top left, the better it is. So we can now try generating many models and plotting them in ROC space to see how efficient they are.
At last. No longer simply trusting that machines have learned, but a way of finding out what they know. ®


