This article is more than 1 year old
So you've 'seen' the black hole. Now for the interesting bit – how all that raw data was stored
Wait, what do you mean 'helium disk drives aren't interesting'?
The black hole image released yesterday needed over a thousand helium-filled disk drives to record it.
Regular drives were tried and tested but failed due to air pressure at the high altitudes of the radio telescope sites.
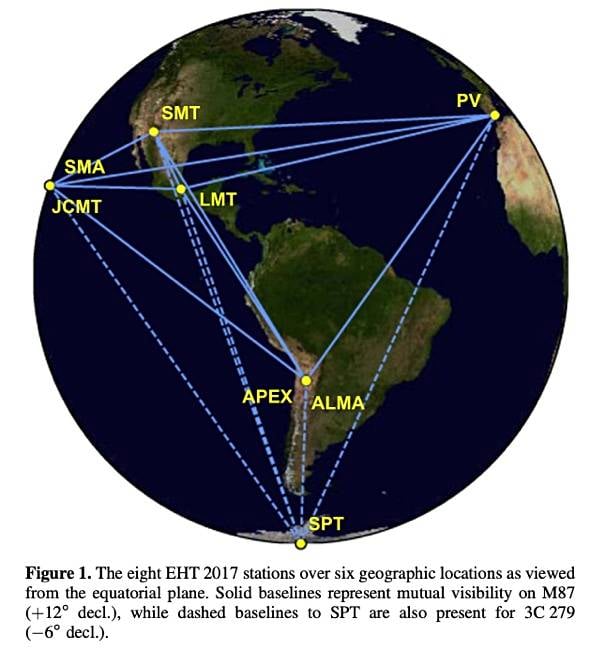
Eight radio telescopes at six locations formed the Event Horizon Telescope (EHT) array, which contributed the data used to calculate the image of the black hole in the Messier 87 galaxy:
- Hawaii: James Clerk Maxwell Telescope and Submillimeter Array at an altitude of 4,092m
- Mexico: Large Millimeter Telescope Alfonso Serrano (4,600m)
- Arizona: Submillimeter Telescope (3,185m)
- Spain: IRAM NOEMA observatory, Sierra Nevada (2,850m)
- Chile: APEX (5,100m) and ALMA (5,000m) telescopes, Atacama Desert
- Antarctica: South Pole Telescope (2,800m)

In effect, they simulated a single radio telescope the size of planet Earth.
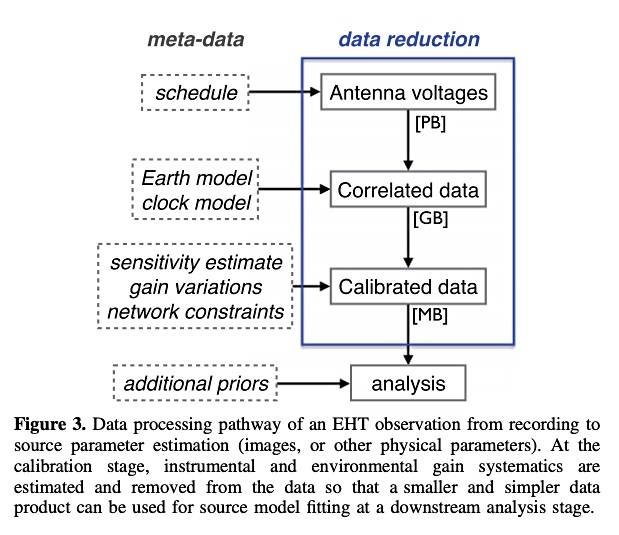
The telescopes take images as Earth rotates to build a picture of the target area taken from different locations on the surface of the planet. The technique used to combine the signals is called very-long-baseline interferometry (VLBI), at a wavelength of 1.3mm, which uses hydrogen maser atomic clocks to precisely time stamp the raw image data. A specially developed algorithm combined and correlated the raw data to build the single overall image.

VLBI allows the EHT to achieve an angular resolution of 20μas (micro-arcseconds) – said to be good enough enough to read a newspaper in New York from a sidewalk in Paris or locate an orange on the surface of the Moon from Earth.
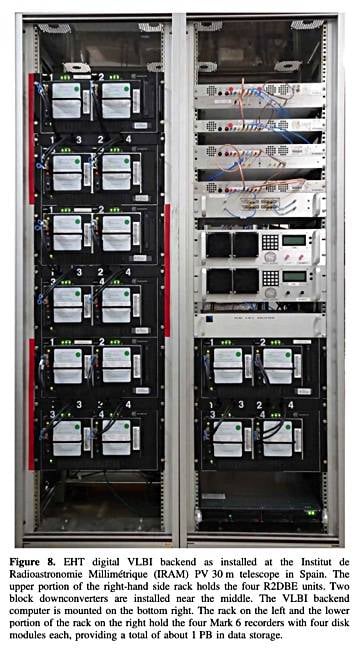
The images from the eight telescopes were collected over five nights from 5-11 April in 2017. Observations were triggered when the weather was favourable, with each telescope generating about 350TB of data a day. A single-dish EHT site (PDF) could record its data at 64Gbit/s. The data was recorded in parallel by four digital back-end (DBE) systems on 32 helium-filled hard drives each, 128 drives in total. Eight telescopes x 128 drives = 1,024 in total.
Western Digital's HGST 8TB helium-filled drives were used, whereas capacity and cost limitations ruled out SSDs.
350TB of data a day for five days roughly means 1.75PB of raw VLBI voltage signal data from each radio telescope, with the combined total being 14PB. The DBEs captured data from upstream equipment using 2 x 10 Gbit/s Ethernet network interface cards at 16Gbit/s. They wrote time-slice data using a round-robin algorithm across the 32 hard drives. These drives are mounted in groups of eight in four removable modules.
The low ambient air density at the telescope sites necessitated sealed, helium-filled hard drives, both for the system disk for recorders and also in all the data recording modules. Ordinary air-filled drives crashed when tried out in 2015; the air was too thin to provide the cushion needed to support the heads.
The HDD modules were flown to the Max Planck Institute for Radio Astronomy (MPI) in Bonn, Germany, for high-band data drives, and MIT Haystack Observatory in Westford, Massachusetts, for low-band data.
Flights from the Antarctica telescope were delayed until austral spring, November 2017.
Supercomputers, called Correlators, at MPI and MIT correlated the raw image data from the telescope location records.
According to the black hole paper (PDF), the processing involved an Earth geometry and clock/delay model to align the signals from each telescope to a common time reference. A correlation coefficient was calculated between antennas.

Correlation was performed using the DiFX software running on clusters of more than 1,000 compute cores at each site, and is split between the two sites to speed processing and allow crosschecks. The correlation processing is described here (PDF).
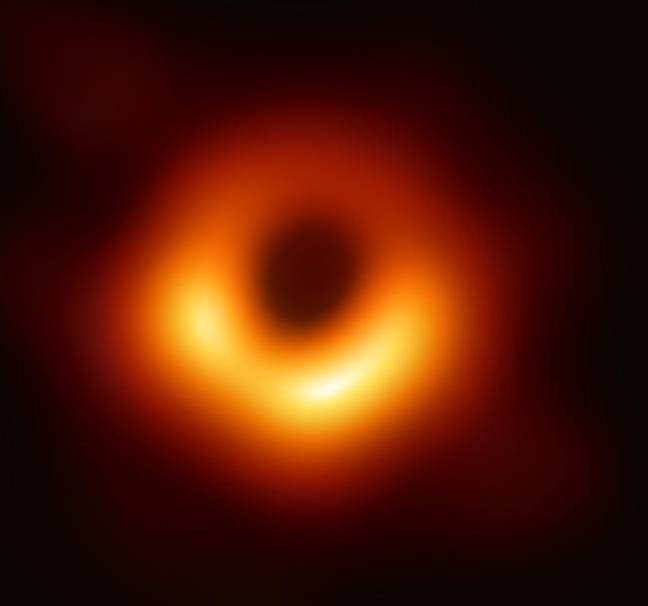
The end result was the staggering image of the black hole's shadow implied by the high-speed, high-temperature particles being drawn into it in a rotating stream.
It's appropriate in a way that the raw image data showing this was captured on rotating disk drives. ®
Bootnote
The BBC Earth Twitter account put things into perspective comparing the data that got humanity to the Moon, and the data that got us the black hole – all on disk drives again. Funny how things change.
1969: Margaret Hamilton alongside the code that got us to the moon
— BBC Earth (@BBCEarth) April 11, 2019
2019: Katie Bouman alongside the data that got us to the black hole
Via @bendhalpern pic.twitter.com/ldlvMlOVXS

