This article is more than 1 year old
New Relic guzzles down CodeStream to help devs jump straight from app error telemetry to offending code
'I can debug production from the IDE,' said CS boss Peter Pezaris
Observability company New Relic has acquired CodeStream, specialists in developer collaboration, with the aim being to connect observability data with code in the development environment.
CodeStream, founded in 2017 by Peter Pezaris, adds instant developer communication to coding environments. For example, a developer puzzling over some code written by a colleague can click next to that code, type a message to the other dev, and they will receive it either in the IDE if they happen to be working on the same project, or in a messaging tool such as Slack, complete with a reference to the code in question. They reply, and a discussion begins.
Although it may seem a small thing, given that they could just use Slack (or any number of other messaging services) directly, the context and convenience makes it a worthwhile collaboration tool. CodeStream also integrates with pull requests from GitHub, GitLab, BitBucket, and issue management from Jira, Trello and others.
Although what CodeStream does sounds related to tools such as Visual Studio Live Share or JetBrains Code With Me, which support pair programming, the company considers them complementary. Live Share is for real time collaboration whereas CodeStream is asynchronous, Pezaris told us. "We use them for different things."
New Relic quietly acquired CodeStream "a little more than three months ago," Pezaris told the Register, and the team has been working on a new IDE integration that does something more unusual, connecting telemetry received from production applications with the relevant code, the integrations currently being for Visual Studio Code, Visual Studio, and the JetBrains family.
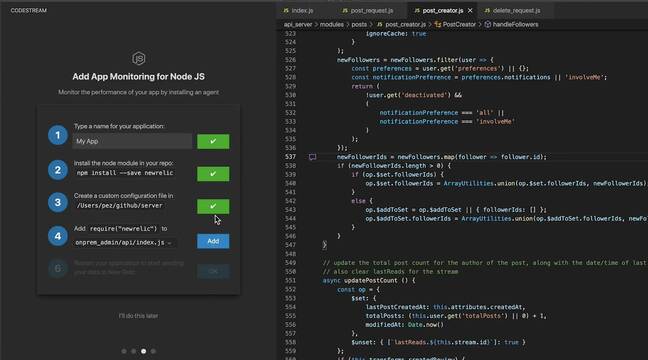
The best way to explain this is to describe a workflow. In the IDE, the developer can add app monitoring, which instruments the application to produce telemetry. The running application now sends data to New Relic where it can be viewed using online tools.
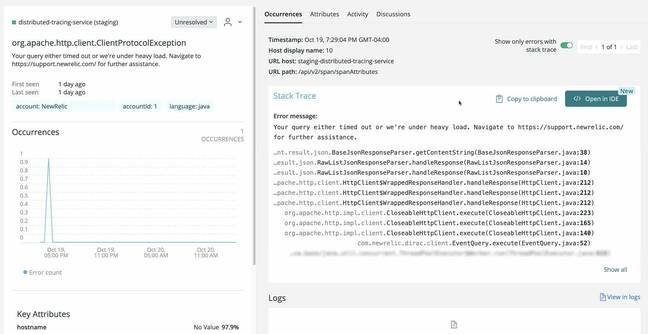
If an error occurs, it is reported with a stack trace in the New Relic Errors Inbox, where a button now offers "Open in IDE." This uses a protocol handler to open the IDE, for example Visual Studio Code, with the project loaded and the faulty code on view.

'Open in IDE' can be used to jump from an application error in production to the responsible code in a development environment
"Prior to this launch, if I was looking at a stack trace, the best tool at my disposal is this copy to clipboard link," said Pezaris, "then manually find what lines of the code I have to navigate to. Now CodeStream makes that super simple."
I can debug production directly from my IDE
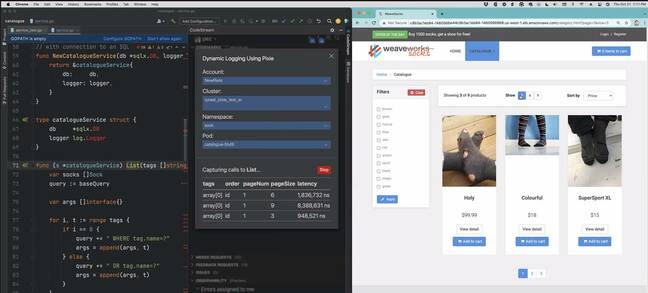
Pezaris showed us another demo involving Pixie: this concerns telemetry that is not collected via application instrumentation. Instead, eBPF (extended Berkeley Packet Filter) programs running at the kernel level are used to gather data on how a chosen bit of software is being used. In the demo, the developer opens some code and then, said Pezaris, "I can click on that function and add dynamic logging, so without having to deploy anything to production, CodeStream will tell me where this is running in production and I can capture invocations to this function for the next two minutes.
"Now it's using Pixie to install a probe in production and set up a schema. Sometimes this takes a few seconds. Once that's installed, every time this function is called, we'll see data here. I can debug production directly from my IDE."
A developer dream come true, or a security worry, with every developer able to inject stuff into running production boxes? "There's no additional security implications, it's up to the organization to manage," he said.
"All of this is governed by the API keys that are managed by the organization, so you can grant access or not grant access as your organisation sees fit. More security conscious organizations will lock it down through how they distribute keys to their employees."
- New Relic streamlines app monitoring tools, shifts to per-user, pay-as-you-go pricing, adds free tier to lure you in
- DevOps still 'rarely done well at scale' concludes report after a decade of research
- Kubecon 2021: A largely dry and corporate affair where the best bits involved a spot of Kubernetes-hacking roleplay
- GA'day, mate: Open the plonk, turn up a banger, Visual Studio 2019 is officially here (don't get too excited, Mac devs)
Despite this confidence, our question touched a nerve, with Buddy Brewer, GVP and Field CTO Americas at New Relic, hastening to explain that "we have a security team to ensure that we're compliant" with necessary standards.
These tools are in preview and free to use until January 12, 2022. After that, "some advanced features will require a paid user license once free tier limits are reached," goes the press statement.
What programming languages are supported? The initial languages are Java, JavaScript, and .NET but "we plan to roll our additional language support and frameworks in the coming months," said Pezaris. Another change in the pipeline is to add IDE integration similar to that for errors, but with the New Relic performance analysis tools such as Flame Graphs. ®


